ESG Reporting Is Becoming a Finance-Grade Control System | CONSOLYX ESG, Carbon & Sustainability Intelligence Platform
ESG reporting is shifting from voluntary sustainability disclosure to a controlled enterprise reporting discipline. Investors, regulators, governments, boards, lenders, and customers increasingly expect ESG data to be reliable, traceable, comparable, and decision-useful. Organizations now need ESG platforms that connect carbon accounting, framework mapping, audit trails, dashboards, AI insights, FP&A, risk management, and board reporting. CONSOLYX ESG is positioned as an enterprise-grade sustain
ESG Reporting Is No Longer a CSR Exercise — It Is Becoming a Finance-Grade Control System
How ESG, carbon accounting, sustainability data governance, AI insight, and finance-grade controls are reshaping enterprise performance management for governments, multinationals, investors, CFOs, and boards.
Summary
ESG reporting is moving from annual sustainability disclosure to a controlled enterprise reporting discipline. This article explains why CFOs, boards, governments, investors, and sustainability leaders now need ESG data that is governed, traceable, auditable, connected to carbon accounting, aligned with financial planning, and supported by dashboards, workflow and AI insight.
Who Should Read This
· CFOs who need ESG to connect with controls, planning, risk, assurance and board reporting.
· Sustainability Directors who want to move from manual data chasing to governed performance management.
· Government Leaders who need ESG visibility across agencies, regions, facilities, programs and national targets.
· Investors who require reliable, comparable and decision-useful sustainability information.
· Board Members who need ESG oversight beyond annual report approval.
· Enterprise Transformation Teams building scalable reporting, carbon accounting, workflow, dashboards and AI-enabled sustainability intelligence.
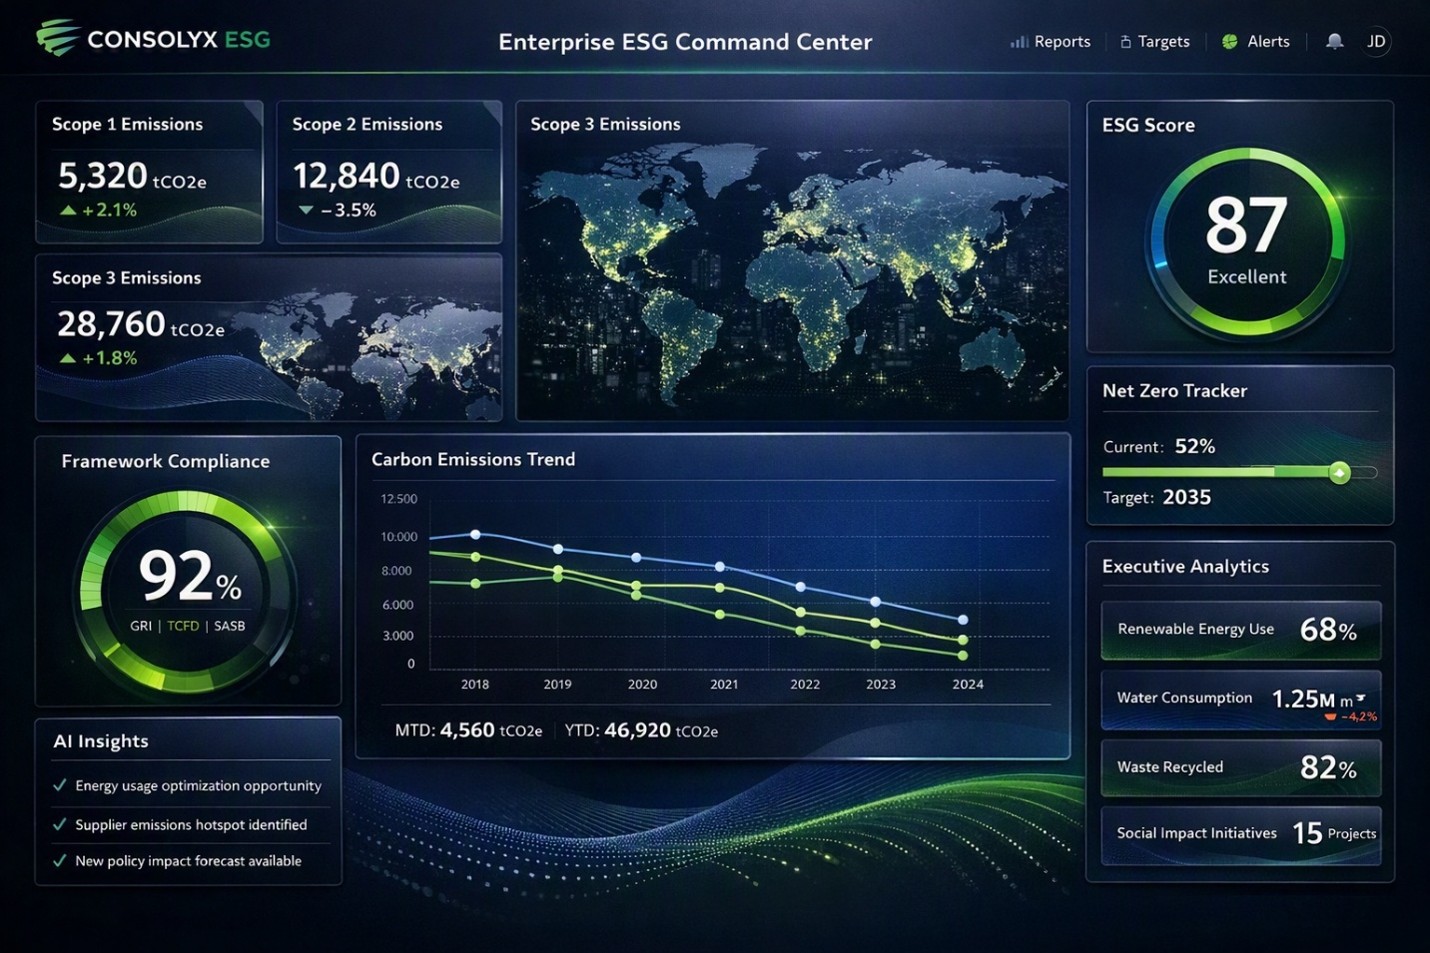
Caption: A single executive view of ESG performance, carbon emissions, framework readiness, targets and AI insights.
For years, ESG reporting lived at the edge of the enterprise. It was often prepared after the financial close, packaged into an annual sustainability report, and positioned as evidence of corporate responsibility. That model is rapidly becoming inadequate. ESG is no longer only a communications exercise. It is becoming a finance-grade control system: structured, governed, auditable, linked to enterprise risk, connected to capital allocation, and visible to the board.
Investors, regulators, lenders, procurement authorities, public sector bodies, rating agencies, and global customers now expect sustainability information to be decision useful. A carbon number can influence financing discussions. A supplier emissions profile can affect tender eligibility. Climate risk disclosure can influence valuation. A weak audit trail can create reputational exposure. In this environment, ESG information must be managed with the same discipline as financial information.
“The next generation of ESG reporting will not be judged by how polished the report looks. It will be judged by whether the data can be trusted, traced, challenged, assured, and used for strategic decisions.”
KEY INSIGHT
ESG is moving from narrative disclosure to enterprise performance management. The organizations that succeed will be those that connect sustainability data with finance, risk, operations, strategy, planning, and board governance.
Enterprise ESG Command Center
An enterprise ESG platform should not present sustainability information as disconnected charts. It should operate as a command center: a single executive view where governments, CFOs, sustainability leaders, investors, and boards can monitor ESG performance, carbon exposure, compliance readiness, risks, targets, and AI-generated insights.
|
Command Center Component |
Executive Purpose |
Recommended Visual Treatment |
|
World Map |
Show multi-country, multi-entity, regional, or government-wide ESG coverage. |
Interactive-style global map with country markers, entity counts, emissions intensity, and compliance status. |
|
Scope 1 / Scope 2 / Scope 3 |
Provide immediate visibility into emissions by source and accountability area. |
Stacked bar chart, donut chart, or three-tile emissions summary with trend arrows. |
|
ESG Score |
Summarize overall sustainability performance for executives and boards. |
Scorecard tile with color banding, trend movement, and drill-down categories. |
|
Compliance Gauge |
Show readiness against selected frameworks, regulations, or reporting standards. |
Gauge or progress ring showing completion percentage, open gaps, and overdue actions. |
|
AI Insights |
Highlight anomalies, missing data, risk signals, target gaps, and management commentary. |
Insight cards ranked by urgency, impact, entity, and recommended action. |
|
Net Zero Tracker |
Track progress against carbon reduction commitments and transition pathways. |
Target vs actual line chart with baseline, current year, forecast, and gap to target. |
Why ESG Has Become a Strategic Priority
|
Investor Expectations |
Investor expectations are rising, with sustainability performance increasingly viewed through the lens of resilience, governance, value protection, and long-term capital confidence. |
|
Climate Risk |
Physical and transition risks are becoming operational, financial, insurance, supply chain, and infrastructure issues rather than isolated environmental topics. |
|
Framework Adoption |
Global sustainability standards are converging around structured disclosure, including ISSB-aligned reporting, ESRS-based reporting, GRI, TCFD principles, and GHG Protocol carbon accounting. |
|
Carbon Accountability |
Organizations are expected to calculate, explain, reduce, and monitor Scope 1, Scope 2, and relevant Scope 3 emissions with consistent methodology and evidence. |
|
Supply Chain Transparency |
Large companies increasingly require ESG data from suppliers, making sustainability readiness a condition for market access and procurement qualification. |
|
Board Oversight |
Boards are expected to understand ESG risks, targets, controls, progress, exceptions, and capital implications rather than simply approve annual sustainability narratives. |
Recent market signals show the scale of the shift. Sustainability leaders report that regulatory compliance, investor expectations, climate risk, and commercial value are now among the strongest drivers of corporate sustainability strategy. Global standard-setting activity is also accelerating, with ISSB-aligned approaches progressing across multiple jurisdictions and European reporting requirements continuing to reshape expectations around data quality, double materiality, and assurance readiness.
From CSR Reporting to Enterprise ESG
The traditional ESG model was built around collection, narration, and publication. The enterprise ESG model is built around governance, validation, calculation, mapping, monitoring, accountability, and continuous improvement. This is a fundamental operating model shift.
|
Dimension |
Traditional ESG |
Enterprise ESG |
|
Purpose |
Corporate responsibility narrative |
Decision-grade sustainability intelligence |
|
Frequency |
Annual or periodic |
Continuous monitoring and reporting cycles |
|
Governance |
Department-led and manual |
Owned, approved, controlled, and board-visible |
|
Auditability |
Limited evidence trail |
Source evidence, workflow approvals, version control, and review history |
|
Technology |
Spreadsheets, emails, and static documents |
Integrated platform, dashboards, carbon engine, workflow, and AI insight |
|
Reporting |
Standalone sustainability report |
Multi-framework reporting for investors, regulators, governments, and boards |
|
Decision Making |
Mostly retrospective |
Forward-looking, risk-based, target-driven, and linked to planning |
|
Executive Visibility |
Limited to final report review |
Real-time dashboard visibility for CFOs, CEOs, sustainability leaders, and boards |
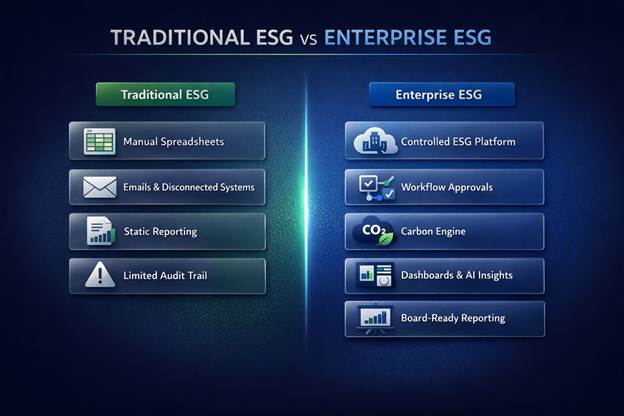
Caption: ESG is shifting from manual reporting to a controlled enterprise performance system.
What Investors Are Looking For
|
Area |
Questions From Investors |
|
Climate Risk |
How exposed is the organization to physical climate risk, transition risk, carbon pricing, energy volatility, and regulatory change? |
|
Governance |
Who owns ESG performance, who approves disclosures, and how is board oversight evidenced? |
|
Carbon Reduction |
Are emissions targets supported by credible initiatives, capital plans, operational accountability, and measurable progress? |
|
Targets |
Are sustainability targets connected to budgets, timelines, owners, baselines, and performance dashboards? |
|
Supply Chain |
Can the organization identify supplier exposure, Scope 3 dependencies, human rights risks, and procurement vulnerabilities? |
|
Data Reliability |
Can reported ESG figures be traced to source evidence, approved methodologies, audit trails, and repeatable calculations? |
BOARDROOM QUESTION
If an investor, regulator, auditor, or public sector client challenged one material ESG number tomorrow, could management prove the source, methodology, approval, and calculation history within minutes?
The CFO Perspective: ESG Is Becoming Part of the Control Environment
For CFOs, ESG is increasingly connected to the disciplines they already manage: close calendars, master data, consolidation, controls, materiality, audit readiness, planning, forecasting, risk, and board reporting. The CFO’s role is not to replace the sustainability director. It is to help move ESG from fragmented collection to controlled enterprise reporting.
Consider carbon accounting. Scope 1 emissions may be linked to fuel consumption, fleet usage, boilers, generators, and industrial processes. Scope 2 emissions depend on electricity, cooling, and energy contracts. Scope 3 emissions involve suppliers, logistics, travel, purchased goods, capital goods, product use, waste, and value chain assumptions. Each of these data streams has financial, operational, and governance implications. The CFO must ask: Are the numbers complete? Are they controlled? Are they comparable? Are they assurance-ready?
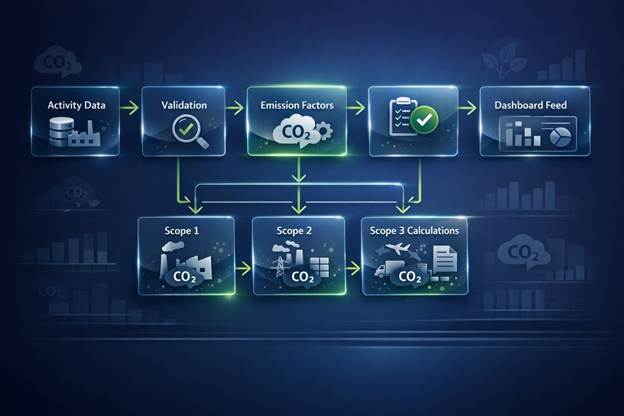
Caption: Activity data, emission factors and approvals flow into Scope 1, Scope 2 and Scope 3 emissions reporting.
Government ESG Requirements
Governments and public sector entities face ESG challenges at a different scale. They must monitor public assets, utilities, infrastructure, agencies, municipalities, hospitals, schools, transport networks, procurement programs, and development initiatives. ESG reporting in government is not only about disclosure. It supports policy execution, budget allocation, citizen accountability, climate resilience, donor reporting, and national sustainability targets.
|
Requirement |
Purpose |
Business Benefit |
|
Carbon Accounting |
Measure emissions across facilities, fleets, utilities, projects, and operations |
Supports climate targets, cost reduction, and infrastructure planning |
|
Energy Reporting |
Track consumption, intensity, savings, and efficiency programs |
Improves budget control and prioritizes energy investments |
|
Framework Compliance |
Align public disclosures with global and local sustainability requirements |
Improves credibility with regulators, donors, investors, and development partners |
|
Audit Trails |
Preserve submission, review, evidence, and approval history |
Strengthens transparency, assurance readiness, and public accountability |
|
Performance Monitoring |
Compare departments, regions, projects, and targets |
Enables timely intervention and policy performance management |
|
AI Insights |
Identify anomalies, missing data, trends, risks, and improvement opportunities |
Improves decision quality and reduces reporting effort |
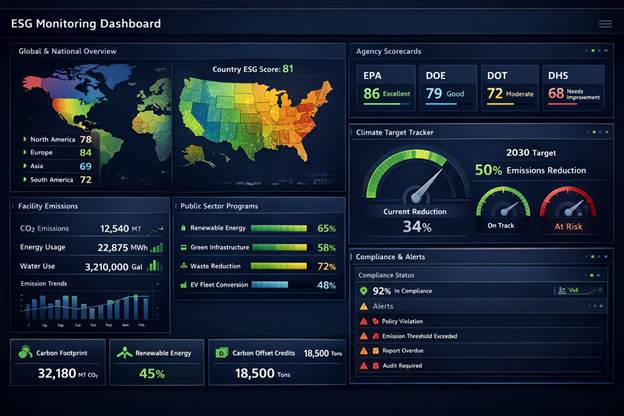
Caption: Public sector leaders need visibility across facilities, regions, agencies, programs and climate targets.
Practical Use Cases
|
Use Case |
Scenario |
Enterprise Value |
|
Government Entity |
A ministry monitors emissions, energy consumption, water usage, waste, and social impact across agencies and regions. |
Creates a national ESG control tower for policy execution, donor reporting, budget planning, and public transparency. |
|
Utility Company |
A power, water, or district cooling operator tracks emissions intensity, asset-level energy performance, transition projects, and customer impact. |
Links sustainability performance with infrastructure investment, regulatory reporting, and operational efficiency. |
|
Manufacturing Group |
A multinational group consolidates ESG and carbon data across plants, warehouses, suppliers, and countries. |
Supports Scope 1, Scope 2, Scope 3 reporting, customer disclosures, procurement readiness, and carbon reduction planning. |
|
Healthcare Network |
A hospital group tracks energy, waste, water, medical waste, procurement sustainability, employee safety, and community impact. |
Improves operational resilience, compliance reporting, cost control, and stakeholder trust. |
|
Sovereign Wealth Fund Portfolio |
A fund monitors ESG performance across portfolio companies, sectors, geographies, and investment themes. |
Enables portfolio-level risk oversight, investment screening, target tracking, and board-level sustainability intelligence. |
ESG Maturity Model
|
Level |
Maturity Stage |
Description |
|
Level 1 |
Spreadsheet ESG |
Data is collected manually through spreadsheets and emails. Reporting is reactive, fragmented, and difficult to audit. |
|
Level 2 |
Managed ESG |
Basic ownership, templates, and periodic reporting exist, but validation and evidence trails remain limited. |
|
Level 3 |
Dashboard ESG |
Dashboards provide visibility into selected KPIs, but data collection, calculation, framework mapping, and workflow may still be disconnected. |
|
Level 4 |
Integrated ESG |
ESG data connects with finance, operations, risk, FP&A, carbon accounting, approvals, audit trails, and multi-framework reporting. |
|
Level 5 |
AI-Powered ESG Intelligence |
AI supports anomaly detection, target monitoring, narrative drafting, scenario analysis, gap identification, and executive insight on governed data. |
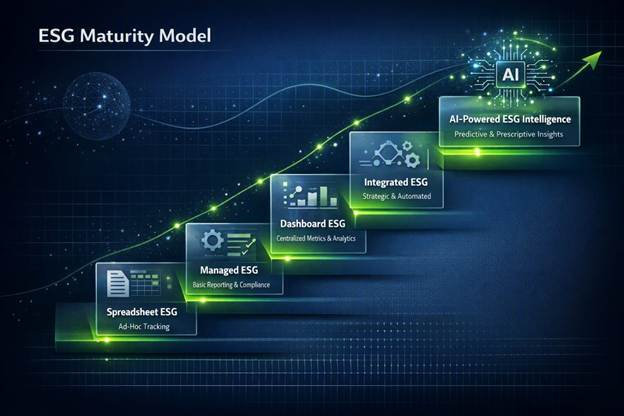
Caption: Organizations progress from spreadsheet ESG to AI-powered sustainability intelligence.
The Future ESG Operating Model
|
Operating Layer |
What It Must Do |
|
Data Collection |
Capture ESG and carbon data from entities, facilities, departments, suppliers, and systems. |
|
Validation |
Check completeness, reasonableness, ownership, period alignment, duplicate records, and source evidence. |
|
Carbon Engine |
Calculate Scope 1, Scope 2, and relevant Scope 3 emissions using approved emission factors and controlled methodology. |
|
Framework Mapping |
Map one ESG data foundation to multiple reporting standards, frameworks, stakeholder formats, and regulatory requirements. |
|
Reporting |
Generate management reports, regulatory disclosures, investor packs, government submissions, and sustainability narratives. |
|
Dashboard |
Provide real-time visibility into targets, performance, exceptions, trends, regions, entities, and risk areas. |
|
AI Insights |
Identify anomalies, missing data, target gaps, performance drivers, and recommended management actions. |
|
Board Reporting |
Translate ESG data into board-level oversight: risks, targets, exceptions, accountability, capital implications, and strategic decisions. |
Why CONSOLYX ESG Is Different
CONSOLYX ESG is positioned for the new era of sustainability intelligence: one where ESG, carbon, finance, FP&A, risk, reporting, and AI insight must work together. It is designed for governments, multinationals, large groups, public sector entities, and enterprise portfolios that need more than a static report.
· Carbon Accounting: Structured Scope 1, Scope 2, and Scope 3 data capture, calculation logic, emission factor management, and target tracking.
· ESG Reporting: Controlled reporting across environmental, social, governance, and sustainability performance indicators.
· Framework Mapping: Alignment to global and local reporting frameworks, including investor, regulatory, public sector, and enterprise requirements.
· Target vs Actual: Monitoring against sustainability targets, carbon reduction pathways, energy efficiency programs, and strategic ESG commitments.
· Dashboard Analytics: Executive dashboards for entities, regions, facilities, departments, categories, emissions, targets, and exceptions.
· AI Insights: Intelligent review of anomalies, missing data, performance movements, management commentary, and improvement opportunities.
· Government Monitoring: Public sector visibility across agencies, departments, municipalities, projects, and policy programs.
· Enterprise Scalability: Multi-entity, multi-country, multi-framework, and multi-user architecture suitable for large organizations.
· FP&A Alignment: ESG targets can be connected to budgets, forecasts, capital planning, operating plans, and scenario analysis.
· Financial Consolidation Alignment: ESG reporting can align with group structures, entities, branches, reporting periods, consolidation logic, and executive reporting cycles.
· Audit Readiness: Evidence management, approval history, data ownership, version control, and calculation traceability support assurance readiness.
· Multi-Country Reporting: Organizations can manage ESG disclosures across jurisdictions, subsidiaries, reporting obligations, and stakeholder expectations.
FUTURE TREND
The leading ESG platforms will not be separate reporting tools. They will become sustainability intelligence layers inside enterprise performance management, finance transformation, public sector monitoring, and board governance ecosystems.
What This Means for Leaders
|
Leader |
Practical Implication |
|
CFO |
ESG must connect to reporting, controls, planning, risk, capital allocation and assurance. |
|
Sustainability Director |
ESG must move from manual data chasing to governed performance management. |
|
Government Leader |
ESG must support policy execution, public accountability, budget planning and national targets. |
|
Investor |
ESG data must be reliable, comparable and linked to long-term value protection. |
|
Board |
ESG must become part of ongoing oversight, not annual report approval only. |
PLATFORM VIEW
For enterprise organizations, ESG technology should not sit outside finance and operations. It should connect master data, carbon calculations, framework mapping, approvals, dashboards, audit trails and AI commentary into one controlled sustainability intelligence layer.
How Organizations Can Start the ESG Control Journey
Phase 1 — Establish ESG Master Data
Define the controlled foundation: entities, facilities, locations, ESG categories, metrics, KPIs, units, emission factors and frameworks. This is the backbone of consistent reporting.
Phase 2 — Validate Source Data
Validate data for energy, fuel, travel, water, waste, workforce, safety and governance. The objective is to identify gaps, duplicates, ownership issues and weak evidence before calculations begin.
Phase 3 — Run Carbon Calculations
Calculate Scope 1, Scope 2 and Scope 3 emissions using approved emission factor mapping, formula validation and approval review. Carbon numbers should be traceable, explainable and repeatable.
Phase 4 — Build Reporting Output
Prepare the GHG inventory, environmental reports, social reports, governance reports and framework disclosures. One governed ESG data foundation should support multiple stakeholder reporting needs.
Phase 5 — Build Dashboards and AI Insights
Create executive dashboards, carbon dashboards, target vs actual tracking, framework compliance views, AI commentary and risk alerts. This turns ESG reporting into performance management.
Phase 6 — Prepare for Audit and Assurance
Maintain evidence, workflow approvals, audit trails, processing logs and version control. Assurance readiness should be designed into the operating model, not added at the end.
ESG Control Roadmap
|
Stage |
What Happens |
Why It Matters |
CONSOLYX Capability |
|
Master Data |
Define entities, facilities, ESG categories, metrics, units and frameworks. |
Creates a single controlled foundation. |
ESG master data model and multi-entity setup. |
|
Source Data |
Collect and validate energy, fuel, travel, water, waste, workforce and governance data. |
Improves completeness, ownership and evidence quality. |
Data capture, validation rules and evidence tracking. |
|
Carbon Calculation |
Apply emission factors and calculate Scope 1, Scope 2 and Scope 3 emissions. |
Produces repeatable and auditable carbon results. |
Carbon engine, emission factor mapping and formula logic. |
|
Framework Mapping |
Map ESG data to reporting standards and disclosure requirements. |
Reduces duplication and supports multi-framework reporting. |
Framework mapping and disclosure alignment. |
|
Reporting Output |
Generate ESG, carbon, environmental, social and governance reports. |
Supports management, investor, government and board reporting. |
Reporting packs and board-ready outputs. |
|
Dashboard Feed |
Convert governed data into dashboards and performance views. |
Enables continuous monitoring and faster intervention. |
Executive dashboards, carbon dashboards and target tracking. |
|
Workflow and Audit |
Control submissions, reviews, approvals, evidence and version history. |
Strengthens assurance readiness and accountability. |
Workflow approvals, audit trail and processing logs. |
|
AI Insights |
Identify anomalies, missing data, target gaps and risk signals. |
Turns ESG data into timely management action. |
AI commentary, anomaly detection and risk alerts. |
Visual Blueprint and Graphic Recommendations
|
Visual Asset |
Purpose |
Suggested Design |
|
[Enterprise ESG Command Center] |
Hero dashboard showing the full ESG intelligence layer. |
Dark or premium blue-green executive dashboard with World Map, Scope 1/2/3 tiles, ESG Score, Compliance Gauge, AI Insights, and Net Zero Tracker. |
|
[Traditional ESG vs Enterprise ESG] |
Explain the shift from static reporting to controlled enterprise ESG. |
Two-column comparison graphic with “manual/reporting” on the left and “controlled/intelligent/board-ready” on the right. |
|
[ESG Maturity Model — 5 Levels] |
Show the transformation journey from spreadsheet ESG to AI-powered sustainability intelligence. |
Five-level staircase or maturity ladder: Spreadsheet ESG, Managed ESG, Dashboard ESG, Integrated ESG, AI-Powered ESG Intelligence. |
|
[Carbon Accounting Workflow] |
Explain how activity data becomes reliable emissions reporting. |
Flow from Activity Data → Validation → Emission Factors → Scope 1/2/3 Calculation → Review → Reporting → Dashboard. |
|
[Government ESG Monitoring Dashboard] |
Show how governments can monitor agencies, regions, projects, emissions, and sustainability targets. |
Map plus agency scorecards, emissions by region, compliance status, program progress, and alerts. |
|
[CONSOLYX ESG Platform Architecture] |
Position CONSOLYX as an enterprise-grade platform rather than a dashboard-only tool. |
Layered architecture: Data Sources, ESG Data Model, Carbon Engine, Framework Mapping, Workflow & Audit Trail, Dashboards, AI Insights, Board Reporting. |
Recommended Visual Hierarchy
1. First visual: Enterprise ESG Command Center — creates immediate premium impact.
2. Second visual: Traditional ESG vs Enterprise ESG — explains the business transformation.
3. Third visual: Carbon Accounting Workflow — proves technical and regulatory credibility.
4. Fourth visual: ESG Maturity Model — helps clients identify where they are today.
5. Fifth visual: Government ESG Monitoring Dashboard — supports public sector proposals.
6. Sixth visual: CONSOLYX ESG Platform Architecture — positions the platform for enterprise scalability.
CONSOLYX ESG Platform Architecture
|
Architecture Layer |
Role in the Platform |
|
Data Sources |
Collect ESG, energy, fuel, emissions, social, governance, supplier, HR, operational, and financial data from systems, files, departments, and entities. |
|
ESG Data Model |
Standardize entities, countries, facilities, departments, periods, indicators, categories, units, and ownership structures. |
|
Carbon Engine |
Calculate Scope 1, Scope 2, and Scope 3 emissions using activity data, emission factors, conversion logic, and period-based rules. |
|
Framework Mapping |
Map ESG data once and reuse it across ISSB, ESRS, GRI, GHG Protocol, TCFD-style reporting, investor packs, and government formats. |
|
Workflow and Audit Trail |
Control submissions, approvals, evidence, calculation versions, review comments, exceptions, and accountability. |
|
Dashboards and Reporting |
Provide executive dashboards, government monitoring, entity reporting, target tracking, compliance views, and board packs. |
|
AI Insights |
Detect anomalies, missing data, unusual trends, target gaps, risk signals, and recommended management actions. |
|
Board and Investor Reporting |
Translate ESG data into concise, assurance-ready intelligence for governance, financing, strategy, and stakeholder communication. |
The Next Decade of ESG Reporting
The next decade of ESG reporting will be defined by integration, automation, assurance, and intelligence. AI will reduce manual effort and improve anomaly detection, but it will not eliminate the need for governance. Digital reporting will make sustainability information more comparable and accessible. Climate risk will increasingly influence strategy, insurance, supply chains, infrastructure, and capital planning. Carbon markets and carbon pricing will push organizations to understand emissions not only as disclosure data, but as financial exposure.
For boards, the question will move from “Do we have an ESG report?” to “Do we have a controlled sustainability performance system?” For CFOs, ESG will become part of planning, reporting, investment evaluation, and risk management. For sustainability directors, the function will become more strategic, data-driven, and technology-enabled. For governments, ESG platforms will support national sustainability monitoring, public accountability, and development funding visibility. For investors, ESG data will become a stronger lens for assessing resilience, governance quality, and long-term value creation.
Ready to Move ESG from Reporting to Intelligence?
CONSOLYX ESG helps governments, enterprise groups and sustainability leaders move from fragmented ESG reporting to controlled, auditable and AI-enabled sustainability intelligence.
· Explore CONSOLYX ESG
· Book a Platform Walkthrough
· Discuss Your ESG Reporting Model